21 Jul 2022
Trend Cycles
Trend Trading Techniques
Most technical analysts study price movements over time using bar charts. This method, while very important, does not take advantage of the "other" data series on the chart, time. Cycle analysis attempts to find recurring major and minor peaks and troughs in price movement for better trade timing. In this edition of Tips, we will take a brief look at cycles and point out one immediately useable fact about them.
What’s a Cycle?
A cycle is simply a regularly occurring sequence of events. The sun rising every morning and setting in the evening is a cycle. The four seasons are one cycle. In financial and commodity markets, a cycle is loosely defined as price movement of a market from a local bottom to a local top and back again. For example, if a market is in a 10 point trading range with a bottom of 40 and a top of 50, the price movement from 40 to 50 and back to 40 again is one cycle. Traders can use this information to enter low risk buys at 40 and low risk sells at 50.
Cycles, just like price trends, can be long, short or intermediate in length. A specific market may have a 20 day, 52 week and 5 year cycle, all acting together to describe price activity. By adding the cycles together, the actual price activity can be forecast.
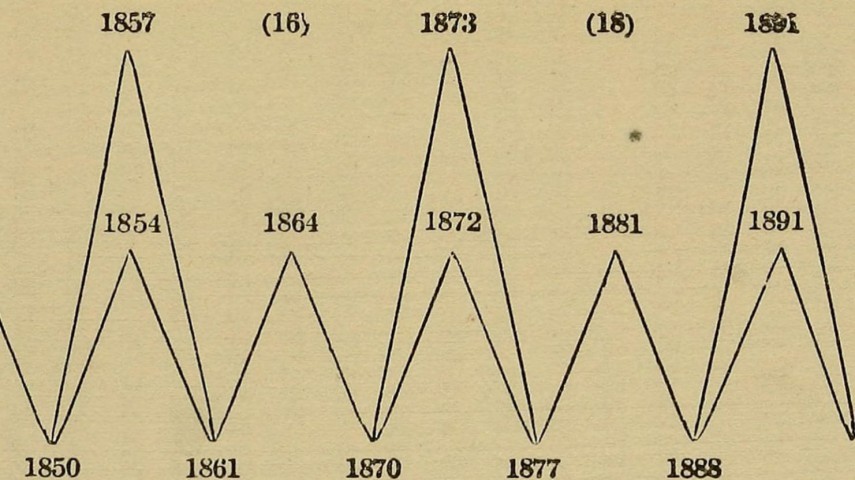
To better illustrate how cycles are added let’s return to the sun and the seasons. By adding the annual seasons cycle to the daily sun cycle, we can forecast a likely temperature for any time of day for any given date (figure 1).

The US Treasury bond continuous futures contract showed very clear cyclical behavior in the mid1980’s (figure 2). From the major low in mid-1984 to the major low in 1987, both marked with "M," we can deduce a roughly three year cycle. Within the long term cycle, there is a medium term cycle of about eight months. Each of these minor cycle bottoms is market with an "m." Just as in the weather example on the previous page, adding the two cycles together defines the likely trading activity in the market. A shorter term chart would also show daily and intraday cycles to further refine the market forecast.

Left and Right Translation
In a trading range, cycles are fairly regular in that the market peaks half way through the cycle. However, when a market is trending, the cycle peak tends to shift left or right in the direction of the larger trend. This is consistent with the notion that in rising markets, prices should spend more time going up and in falling markets, price should spend more time going down. For example, in the bond example above, each of the intermediate peaks (labelled "t" for top) between major bottom in 1984 and the major top ("T") is shifted to the right. After the market starts to decline, the one clear peak is shifted to the left. During the transition period from major bull to major bear market, the market traded in a volatile trading range the peaks were more centered.
Profiting
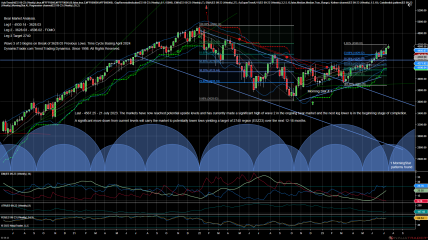
In a flat market, such as the period from October 1993 to February of 1994 (figure 3), the daily chart of bonds illustrates a near term three week cycle. Each cycle bottom occurred on or near support at 113. Buying bonds at the cycle low and reversing the position one and one half weeks later proved to be a successful low risk strategy. The cycle peaks were in the middle of the cycle (no translation) since the larger market trend was flat. Note that the late January cycle bottom never really made it to the support line which reinforces the need to use several technical indicators for trading.

In trending markets, such as in figure 2, the intermediate cycle tops and bottoms provided good places to take profits ahead of each intermediate correction. Conversely, when the major cycle was in a declining phase, the minor cycle bottoms provided good places to take profits from short positions.
Summary
This has been an overview presentation of how cycles interact to define markets and there is much that has not been covered here. In the real world of trading, the size (price moves) and the frequency (cycle lengths) can vary from cycle to cycle in the same market. Cycles are a tool to be used to help forecast likely turning points in the market and never to try to define the market specifically. The market must be allowed to tell you what it wants to do. Any other strategy is a losing proposition.
DynamicTrader Trading Techniques are updated Weekly. Covers Systems, Technicals, & Techniques.
First Published. Year 2000. Archives.
First Published. Year 2000. Archives.